Jonathan, William, and colleagues publish a paper in Plants titled “Historical Assembly of Andean Tree Communities”. Thanks to Sebastián González-Caro for leading this project!
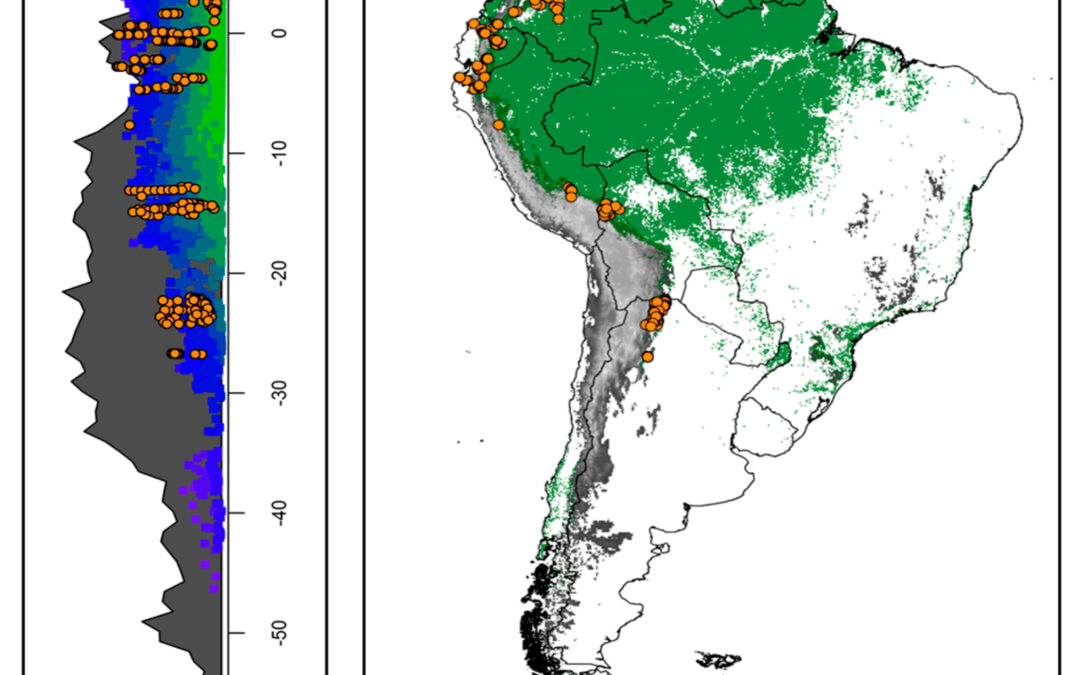
Figure: Distribution of 245 forest plots (orange points) along elevational, latitudinal, and environmental gradients in six countries across the subtropical and tropical Andes. (A) Elevational profile of the Andes in South America (gray area). Colored areas reflect the distribution of forests in this profile. Colors are based on the first axis of a principal component analysis from all temperature variables in Worldclim (https://www.worldclim.org/). Green squares represent warmer and less seasonal sites, while blue squares are colder, more seasonal sites. (B) Spatial distribution of plots in South America. Gray areas represent mountains over 1000 m asl, while areas in green show forest-covered areas of South America.