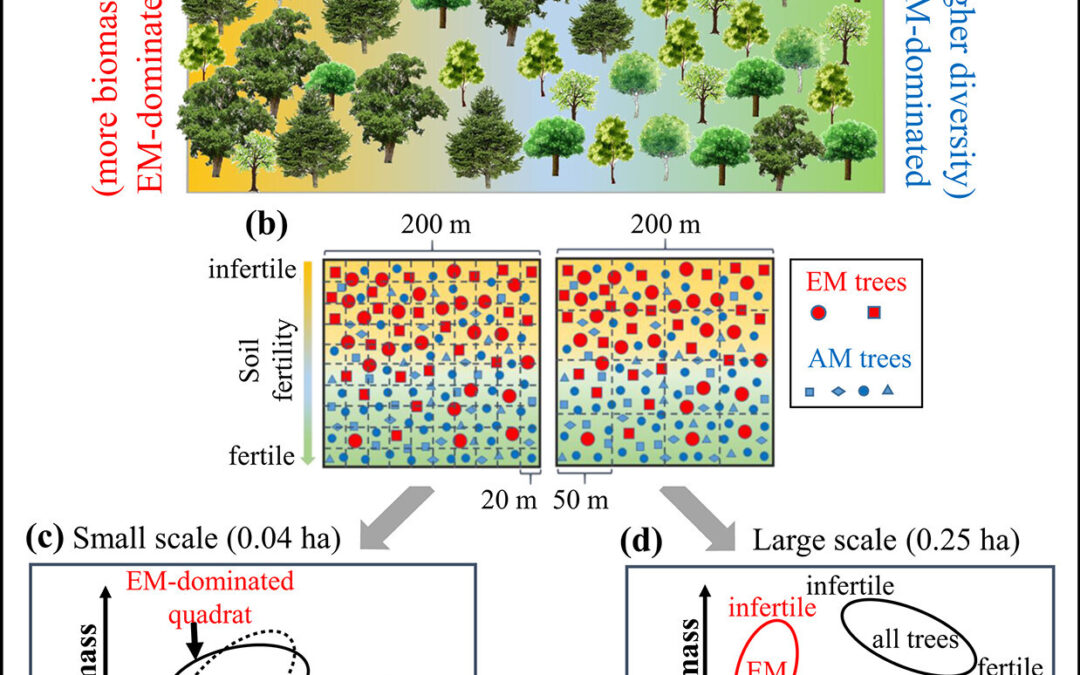
Jonathan and colleagues in the ForestGEO network publish a paper in Ecological Monographs titled “Scale-dependent diversity–biomass relationships can be driven by tree mycorrhizal association and soil fertility”. Thanks to Zikun Mao and and Xugao Wang for leading this project!
Figure: The mycorrhizal dominance mechanism about how soil fertility-related changes in tree mycorrhizal dominance (i.e., arbuscular mycorrhizal [AM]-dominated vs. ectomycorrhizal [EM]-dominated) modulate the relationship between tree diversity and standing biomass at different spatial scales (i.e., quadrat size) within local AM–EM mixed forests. (a) Representation of expected forest community located in heterogeneous soil environment (background color [yellow: infertile soil; green: fertile soil]), which contains two EM tree species (dark green) and four AM tree species (light green). In this forest, EM trees are mainly distributed in infertile soil (EM-dominated), while AM trees are mainly distributed in more fertile soils (AM-dominated). Because the EM tree community (sensu Mao et al., 2019: “EM tree community” represents all tree species associated with EM fungi in a local community) contains bigger trees and the AM tree community includes more and smaller tree species, the spatial patterns of AM and EM tree species lead to the spatial variation of tree diversity and biomass along the soil fertility gradient. (b) One 200 × 200-m2 plot abstracted from the forest described by panel (a), where the color of the point represents types of mycorrhizal association (red: EM tree community; blue: AM tree community), and the shape and size of points represent different tree species and tree size, respectively. Under this scenario, the tree diversity–biomass relationship (DBR) should be less positive at the smaller spatial scales, e.g., 0.04 ha—panel (c), that is, the observed DBR (the solid ellipse) should be less strongly positive than the null DBR (the dashed ellipse), where the mycorrhizal dominance effect is excluded. At the larger but still local scales, e.g., 0.25 ha—panel (d), since most tree species are AM-associated, we expect that AM tree communities mainly determine tree diversity and thus range more widely along the diversity axis. Meanwhile, EM tree communities mainly affect quadrat biomass and thus range most widely along the biomass axis. As a result, the observed DBRs for all trees should be negative along the soil fertility gradient.

